


ABOUT ME
Welcome to my portfolio!
I'm Sophia Martens, an Industrial Design student of the Eindhoven University of Technology. This portfolio is a reflection of who I am as a designer. Enjoy! ✿✿✿


In a world driven by speed, many designs neglect the deeper needs of users. Too often, products prioritize functionality and quantity over quality and engagement. As a result, users may feel disconnected, and unaware of a product's potential.
Design that goes beyond just solving problems. It aims to foster deep, meaningful connections. This requires a deep understanding of human needs, not just surface-level wants. Solutions should be intuitive, purposeful, and easily integrated in users lives.

"What is good design?"
VISION
People have practical, emotional, and cognitive needs. Oversimplified designs risk missing the mark, leaving users frustrated and disengaged while businesses lose value.

Businesses play a big role in bringing thoughtful design to life. Success of a design lies in balancing: user benefit, business growth, long-term and societal impact. Therefore, effective collaboration is essential.

IDENTITY
My designs are driven by empathy. I go beyond surface-level feedback to uncover the deeper motivations behind user behavior by immersing myself in the lives of my audience, especially those with unique challenges or underserved needs.
In my work, I strive to balance visual elegance with technological functionality, creating designs that are both seamless and purposeful. I also incorporate market analysis to ensure the solutions effectively reach the right users.


My design approach is user-centered and begins with thorough research and, where possible, gaining an understanding of users in the context of their daily activities. I then move on to brainstorming and co-creation, followed by prototyping. Throughout the process, I collaborate closely with users to test and refine solutions, ensuring they are both relevant and intuitive.
I thrive in collaboration with diverse stakeholders, valuing their perspectives as key to innovation. I listen actively, step up to lead when needed, and question assumptions to ensure every decision is thoughtful.


PROJECTS

Activi

3Dyamic
.jpg)
SeeQuence

ArtBeat


User & Society
The first design process I learned was the User-Centered Design process, which has since become the core approach I rely on, as told in my identity. It begins with understanding the user and their needs through methods like interviews, questionnaires, empathy maps and observations. These insights can be translated into personas and storyboards or customer journeys that map out user challenges and experiences.
Why is this important? Because I learned that relying solely on assumptions or research, as I did in the 3Dynamic Cast project, can lead to problems. There weren't any end-users involved in the process, and as a result, our cast turned out too small for people’s arms during the demonstration. While expert input can be valuable, experts don’t know everything. It’s essential to observe users to gain first-hand insights, because what you notice might differ from what others report.
Since then, it was a goal of mine to involve stakeholders throughout the design process. I enjoy facilitating co-creation sessions and user testing, bringing together diverse perspectives to shape better, more inclusive outcomes.
During my internship at FrieslandCampina, I was introduced to neuromarketing tools such as implicit association testing, blur testing, and heatmap analysis. I now occasionally use these methods to assess how users visually engage with designs. They help quickly validate whether key elements are noticed and understood at a glance, and inform how designs can be tailored to user perception.
At TU/e, I built a strong foundation through core courses and selected electives that aligned with my vision. Rather than listing them all, I’ll group them by expertise areas and highlight the key skills I gained.


Throughout my bachelor’s, one question kept recurring for me: What role does the business side play in the design process? Driven by the goal of creating impactful solutions through an understanding of both people, systems, and market dynamics that support innovation, I chose to focus my electives on business-related courses. This allowed me to explore how strategic thinking can complement user-centered design.
Choosing Industrial Design wasn’t a random choice, it was a natural next step.

Business Model Canvas of SeeQuence
Onion map for a new HEMA value proposition: targeting sustainable users via the Snuffelmuur
Image from the MarketStrat simulation course showing the pricing of our product, TOPS, compared to similar competing products


SWOT analysis about the redesign of Switch2Move
Technology & Realization

Creativity & Aesthetics
During the programming of a game via Processing and controlling it with an Arduino UNO, I had my first experience with technology. This introduced me to the process of translating abstract ideas into interactive systems using appropriate tools and code. I learned that programming becomes more approachable when you experiment regularly. It also became clear that performing calculations in advance and consulting datasheets is essential when working with electronics. This practice not only helps you critically evaluate the logic of your choices but also fosters a deeper understanding of how components behave.
In a recent project, I set myself the goal of independently developing a complex circuit by integrating multiple components. I began by testing each part individually, then moved on to combining them into a single system. The process was highly iterative and involved frequent troubleshooting; identifying whether issues were caused by the code or the wiring, making adjustments, and learning from each mistake. This experience reinforced how much insights come from experimentation and reflection, especially when things don’t work the first time. I’ve come to see this mindset as essential in industrial design.
I also explored non-electronic forms of technology in the 3Dynamic Cast project. Here, we embedded nichrome wire into a 3D-printed PLA structure. When heated, the structure became bendable. Designing this required precise modeling to fit the wire, and using datasheets to determine the right current and voltage. Through this, I realized that designing with technology also includes understanding materials, and applying physics to bring interactive concepts to life.
These experiences have strengthened my ability to apply technical reasoning to inform my design decisions and create high-quality interactive systems, aligning with my vision of designing meaningful experiences rather than purely quantitative products.

Created a scatter plot to test the hypothesis that temperatures between 25–35°C positively correlate with ozone levels in Eindhoven (2014–2019), and evaluated it using a Pearson correlation test
.jpg)
Created a bar chart to visualize the average step count of participants throughout the day, based on data collected with the Mi Band

Exploring with Processing to create interesting visuals

Sitelucent. (2025). Screenshot of general data visualization dashboard. Sitelucent. https://www.sitelucent.com/
At first, I saw aesthetics mainly as how something looks; its shape, color, material, texture, and overall visual appeal. And that still plays an important role. For example, when designing SeeQuence, we intentionally chose a retro theme and created a physical mood board to guide our visual decisions. Similarly, for Activi, I carefully selected colors and shapes in collaboration with users.
However, I’ve come to understand that aesthetics are not just about appearance, they also influence how users interact with a product and the emotions it evokes. This is where emotional design plays a crucial role. The look and feel of a product can create a strong emotional connection with users, which aligns with the goal in my vision of designing products that are not only functional but also comforting, playful, calming, or energizing. Building on this, I used neuromarketing tools during my internship to optimize hero product images for online platforms, enhancing their emotional impact on users.
Some design approaches begin from the aesthetic experience itself. For example, soma-based design emphasizes the embodied, sensory experience of both the designer and the user. In these cases, the design grows out of a felt experience, rather than starting with function or form.
This inspired some parts of Activi. By incorporating a natural sound that reflects the rhythm of the environment, the product helps users ease into the mood of their activity, rather than simply serving as a static reminder of tasks. It is the starting point of becoming less of a functional object, and more of an emotional experience that responds to users’ mental and physical state.
Another way to explore aesthetic interaction is through small, subtle, and non-standard interactions, that then become the foundation for the overall product. This shifts the focus from how a product looks to how it feels to engage with, making the interaction itself aesthetically and emotionally meaningful.
In short, I’ve learned that aesthetics isn’t just about visual form, but about the full experience: how a product looks, feels, and emotionally resonates with users.
Next year, I will pursue the Innovation Management Master’s track in Collaborative Innovation & Marketing. This track closely aligns with the direction my interests have taken, understanding user needs, managing complex stakeholder ecosystems, and creating value for both users and businesses.
During my Industrial Design studies, I developed a strong foundation in user-centered design, co-creation, systems thinking, and data-driven development. These experiences taught me that truly sustainable innovation goes beyond good design, it requires effective coordination across the entire value chain. This Master’s track will allow me to build on that foundation and apply my skills in a broader, more business-oriented context.
Additionally, I thoroughly enjoyed the process of marketing a product to the right users during my internship. Exploring different techniques to reach and engage the target audience sparked my interest in marketing, which further motivated me to pursue this specific track.


Hummels, C., & Frens, J. W. (2008). The Reflective Transformative Design Process [Diagram]. Springer. https://www.researchgate.net/figure/The-Reflective-Transformative-Design-Process-9_fig1_323353672
Dam, R. F., & Siang, T. Y. (n.d.). The 5 stages of the design thinking process [Diagram]. Interaction Design Foundation. https://www.interaction-design.org/literature/article/5-stages-in-the-design-thinking-process
Karana, E., Barati, B., Rognoli, V., & Zeeuw van der Laan, A. (2015). Material‑Driven Design (MDD) method [Diagram]. International Journal of Design, 9(2), 35–54. https://materialsexperiencelab.com/index.php/material-driven-design-method-mdd/
Cultural probe kits used to collect user data on smartphone usage during leisure activities


.jpg)

JOURNEY
Before Industrial Design, I was already making things, like sweaters and bags, which I sold online. I even had a YouTube channel where I documented my creative process, and I found genuine joy in making things. What amazed me most was that others were interested in what I created. That experience made me realize how much I loved both the process and the impact of my work. So I thought: why not combine my creativity with solid knowledge and skills to design something truly meaningful that can make a difference?

Persona & user journey based on interviews (process of Activi)
Co-creation session (process of Activi)
Experiencing the challenges of blindness through sound memory at the MuZIEum (process of SeeQuence)
Redesign Switch2Move,, using stakeholder input
Bouncy Moon game created, using Processing and Arduino UNO
Electronic circuit of Activi

3D-modeled component for cast framework


Business & Entrepreneurship
_edited.jpg)
User testing (process Activi)


The Business Model Canvas gave me a foundational understanding of how businesses operate. By breaking down elements such as key activities, customer relationships, and stakeholder networks, I gained insight into the nature of product ecosystems. This helped me to see design as part of a larger value chain.
To expand this perspective, I used tools like the Onion Map to identify and categorize stakeholders based on their influence on the user. This helped me better understand stakeholder relationships, particularly in co-creation processes where integrating diverse perspectives is essential and closely aligned with my design identity.
Another key learning was the role of a Value Proposition; how to clearly define the value a design brings to both users and businesses. This dual focus directly aligns with my personal design vision: that user benefit, business growth, and long-term societal impact must be balanced for a design to be truly sustainable.
When exploring how products compare within a market, I learned to use Competitor Matrices and SWOT Analyses. These tools trained me to think critically and strategically, identifying not only how a design can differentiate itself, but also how a business can turn its strengths into competitive advantages.
This was put to the test during a Market Stimulation course, where I had to apply my knowledge in a simulated business environment. We were tasked with anticipating market trends and making strategic decisions across research, marketing, and operations. It was a challenging, practical experience that showed me how design decisions are influenced by real-world business constraints, and how foresight and adaptability are crucial in competitive, evolving markets.
Math, Data & Computing
Fundamental courses like calculus and physics taught me how to approach problems systematically and logically, a mindset that has proven essential in design. Even when the outcome isn’t clear from the beginning, I’ve learned to trust the structure of my process, knowing that thoughtful steps lead to clarity and impactful results.
To make sense of complex and messy realities, I turn to data, not just to collect it, but to translate it into meaningful insights. Using Python Notebooks, I’ve learned how to process and visualize user data in a professional and insightful way. These visualizations help me validate hypotheses, identify patterns, and refine my direction based on evidence.
Before analysis, however, comes the challenge of gathering and cleaning data. I’ve worked with tools like the Mi Band and YODL Kit to track user behavior, environmental data (like humidity and temperature), and physiological patterns. I then applied data cleaning techniques, such as identifying and correcting outliers, smoothing noisy data, and filtering based on relevant time windows, to prepare the datasets for further analysis.
Alongside analysis, I’ve also explored creativity through data. Using Processing, I experimented with creative coding to turn inputs into interactive visuals, bridging functionality with elegance, as described in my identity.
Meanwhile, using Arduino IDE, I controlled electronic circuits by translating data to into actions, combining hardware and software to bring abstract ideas to life.
During my internship, I further expanded my toolkit by working with Sitelucent, a more intuitive data platform used to monitor online product performance. While the system simplifies plotting and filtering, segmenting data by timeframes or performance metrics, it still requires a critical mindset: understanding what type of data to use, what timeframe is relevant, and how to interpret inconsistencies or data gaps. I learned that even with intuitive tools, critical thinking remain essential to extract real value.

Mood board for SeeQuence

Exploring different shapes for redesign Switch2Move
Exploring textures of PolyCaproLactone
Exploring wake-up experience interactions
Embodying an extreme wake-up experience


Design Research Processses
In the 3Dynamic Cast project, we used the Reflective Transformative Design Process. What I liked about this process is that it’s not just about solving problems, but also about envisioning the future you want to help shape. I appreciated how it combines doing, sensing, and thinking with continuous reflecting. However, since there’s no fixed order, it sometimes made it hard to know what step I was in or what to do next.
In contrast, the Design Thinking Process, which I used in ArtBeat and Activi, provides more structure through its five clear stages. It’s also iterative and reflective, but it helps me stay grounded and focused with a clear framework to follow. This was especially helpful in problem-framing. However, its strong user-centered focus can make it harder to look at wider, long-term or societal impacts, which is something RTDP handles more effectively.
I also explored Material-Driven Design in a project that focused on the material Polycaprolactone. Instead of starting from user needs, the process starts by exploring the material’s properties and discovering design potential from there. The outcomes were often unexpected and experimental, which I found exciting. But I missed the connection to users and some guidance in terms of next steps.
Lastly, during a Digital Distractions project, we took a more explorative approach by designing and using cultural probe kits. This method allowed us to collect personal data from users in a non-intrusive and playful way. It encouraged participants to reflect on their own behavior and routines, while giving us deep insights into the role of smartphones during leisure activities.
Overall, I’ve realized I prefer processes that offer a balance between freedom and structure. The Design Thinking Process is still the most comfortable for me because it is structured and user-centered, yet it still gives room for creativity and iteration.
In addition to the hard skills I have acquired throughout my journey, I have also engaged in external activities to further develop my professional skills.

Presenting for a larger audience (InspirID member)
Content management skills
(internship @ FrieslandCampina)
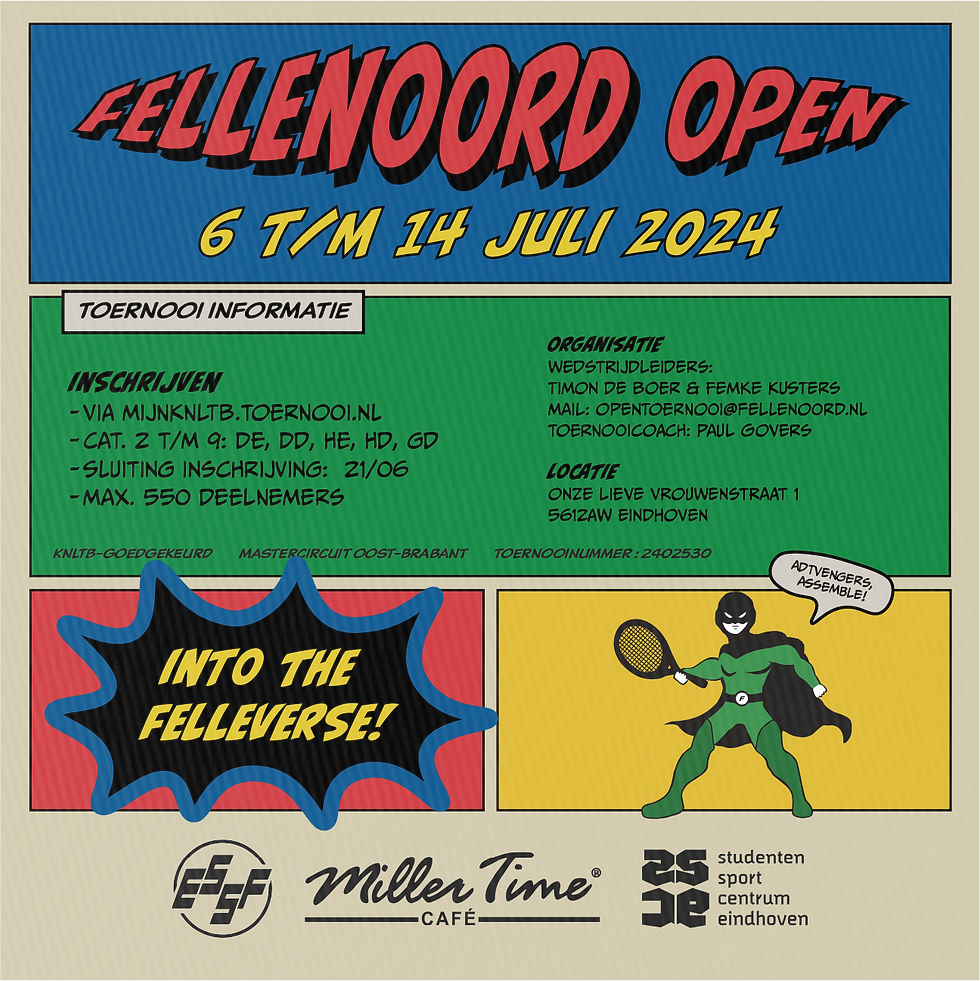
Visual communication skills
(PR director of Open Tournament)


